How Perps Move Low-Float Altcoins: The Vertical Casino Explained

Some altcoins are not moved by organic spot demand. They are moved by leverage, Open Interest, funding pressure, liquidations, and thin float. This is how perp-driven markets work.
In this article, we will break down how to find these markets, filter them, spot them, and understand the mechanics beneath them. Don’t worry, this one is shorter and more example-based. We will focus mainly on trading setups, including how to approach these environments even if you miss the vertical move. You can take your time and wait for fades too. So both bears and bulls should enjoy this one.
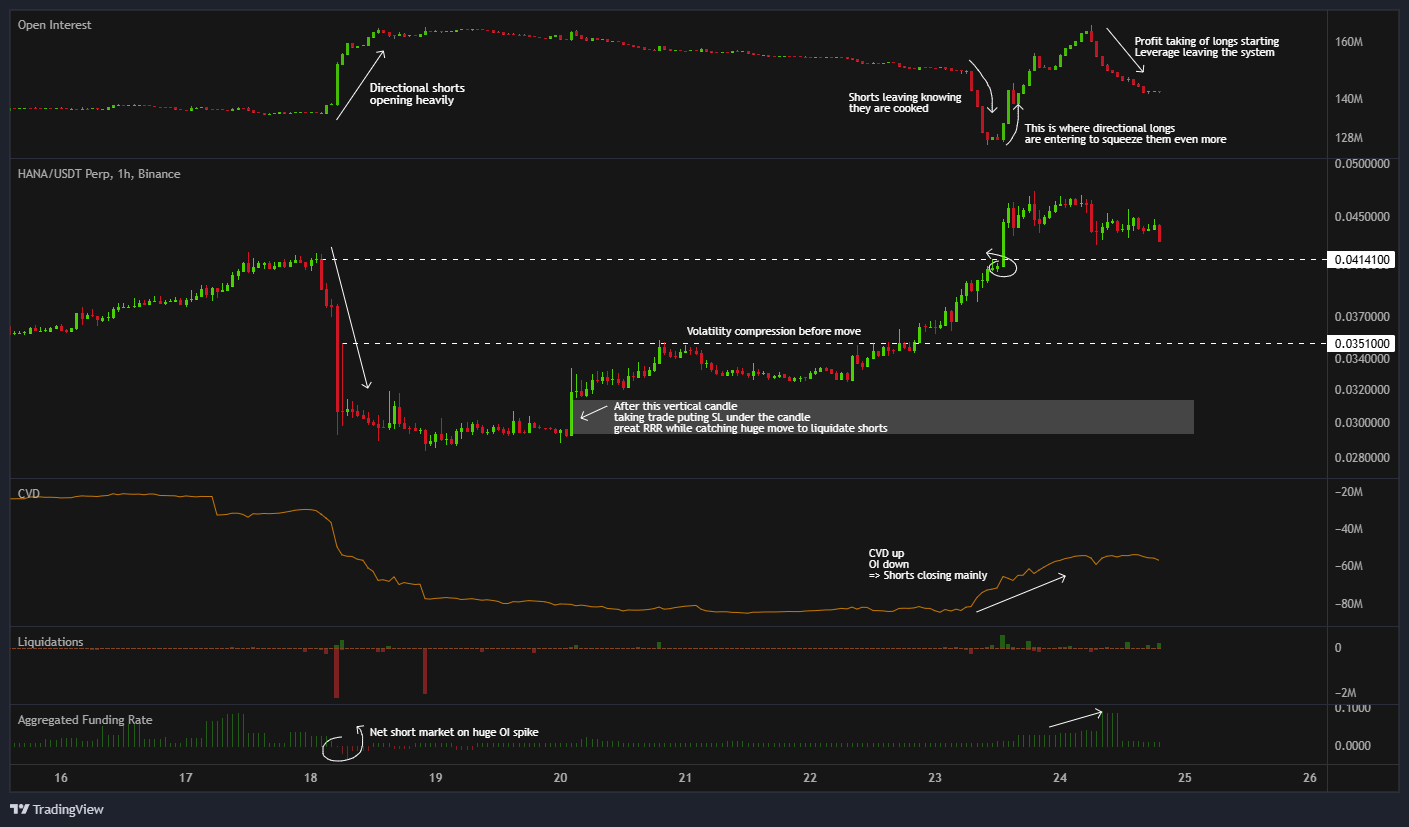
HANA example: classic perp-driven structure. Directional shorts opened heavily, price compressed, then the move started once shorts were forced to close. OI and CVD show the mechanics better than candles alone.
Spot-Led vs Perp-Led Markets
In spot-led markets, buyers move price. In perp-led markets, positioning moves price. That is the whole difference.
A spot-led market is clean. Real buyers are stepping in, real sellers are selling into them, and perps usually just follow the actual spot demand.
A perp-led market is different. Spot liquidity is thin, fragmented, or too weak to control the move. The real battlefield shifts to Binance Futures, Bybit, or whichever derivatives venue has the biggest leverage casino open that day.
At that point, price stops reacting purely to real demand and starts reacting to positioning. That is when Open Interest, funding, CVD, liquidation levels, and market cap matter more than the candle by itself. When the float is small and the perp book gets too big, the coin can start moving like a vertical casino. Not because the project suddenly got better. Not because fundamentals changed overnight. Because positioning became unstable.
The Perp-Driven Altcoin Checklist
Before I even care about the trade, I want to know what kind of market I am dealing with. Is this a real spot-led move where actual buyers are pushing price higher? Or is it a leverage fight on a low-float coin where one side is about to get forced out?
This is basically about positioning. If you want the deeper theory, we covered it here:
Read next: Market Positioning: The Advanced Guide to Open Interest
That context matters more than the candle.
So I usually look at a few things:
- Perp volume vs spot volume
- Open Interest relative to market cap
- Funding pressure
- CVD confirmation or divergence
- Float and MC/FDV structure
- Session behavior
- Spot venue quality
None of these are automatic buy or sell signals.
They are context. The goal is not to predict every single candle. The goal is to understand what type of market the coin is trading in. Is it a normal market with real demand behind it, or is it a leverage trap waiting to resolve?
Perp / Spot Ratio: Where Is the Real Game Happening?
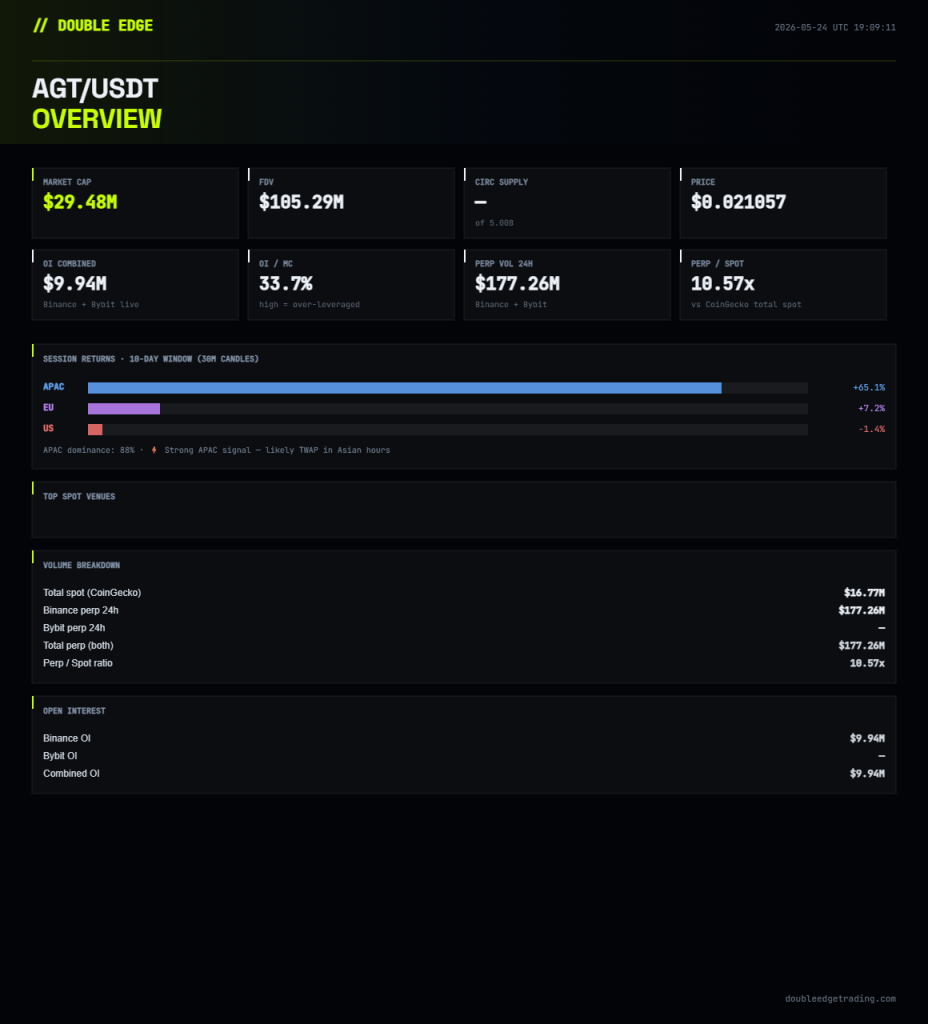
$AGT is a good example.
Perp volume was around 10.57x spot volume. That is the kind of structure where derivatives can become the main venue instead of spot. Sessions also tell you where the vertical move is more likely to appear. In this case, the hint was APAC.
When a coin is doing 5x, 8x, or 10x more volume in perps than spot, it tells you the market is probably not mainly about holders buying the asset. It is about traders fighting with leverage.
OI / Market Cap: Size of the Battlefield
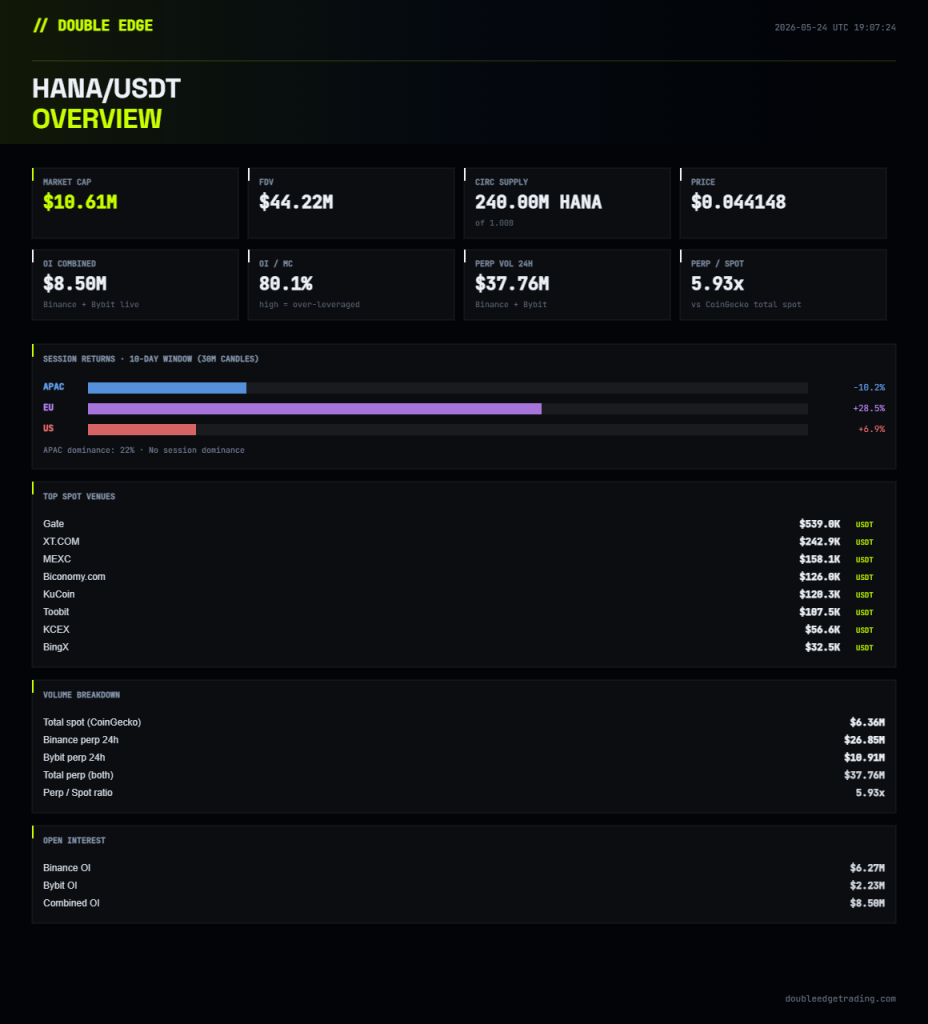
HANA example: OI/MC around 80%. When Open Interest gets close to the market cap, the coin becomes extremely sensitive to positioning. That does not mean “instant short” or “instant long.” It means the battlefield is unstable.
Funding Is Pressure, Not Direction
Funding tells you who is paying to stay in the trade. If funding is positive, longs are paying shorts. If funding is negative, shorts are paying longs. But funding alone is not a buy or sell signal. It is just pressure. It shows which side is more crowded, which side is willing to keep paying, and where the pain can start building if price stops moving in their favor.
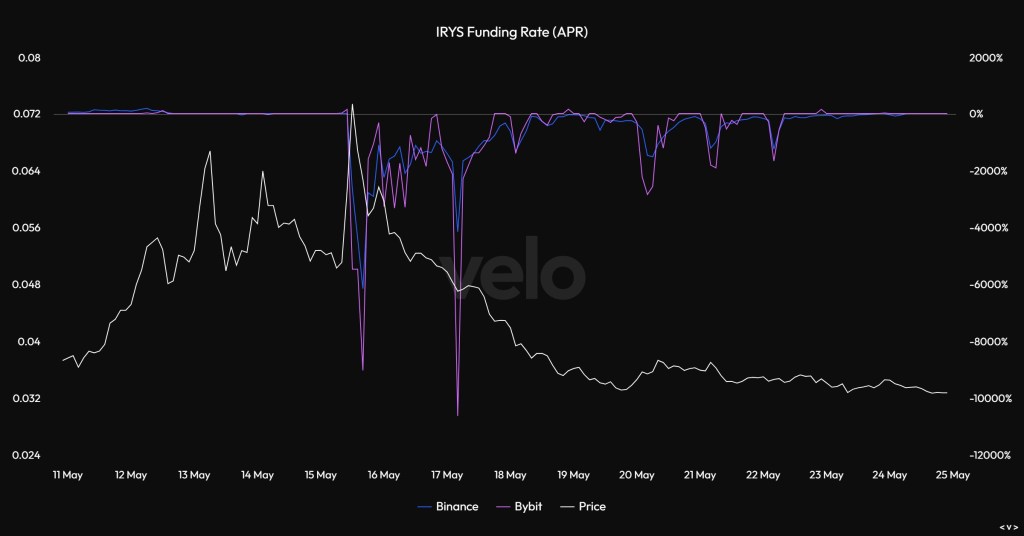
IRYS was a good recent example. Everyone saw the double top at the previous ATH, shorts piled in, and funding went insanely negative. The market squeezed them into a new ATH first, then bled off. The second round of negative funding was different. Shorts were right, they just had to pay for it.
Open Interest + CVD: The Move Under the Move
Candles show the result, but Open Interest and CVD show the fight behind it. If price moves up while OI expands and CVD follows, buyers are stepping in and leverage is supporting the move. If price moves up but CVD stops confirming, the move starts getting fragile. And if OI starts leaving after a big vertical move, leverage is exiting the system. That is where fades can get interesting.
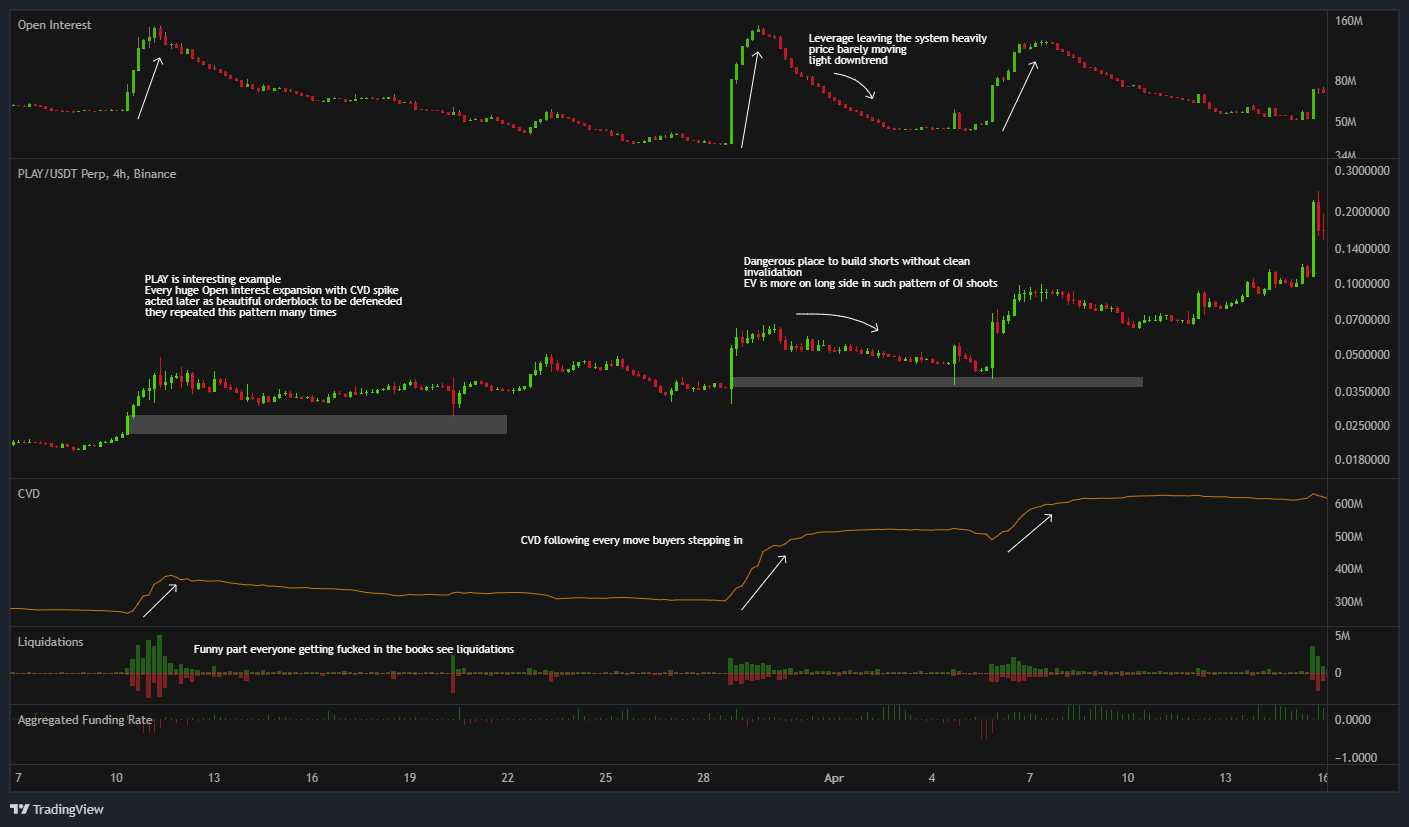
PLAY is a clean example. Every big OI expansion came with CVD confirmation, so it was not just a random candle. Buyers were actually stepping in and each base kept getting defended. The dangerous part came after the vertical move, when OI started draining. That is leverage leaving the system. Chasing late longs there gets ugly, but blindly shorting it too early also gets you cooked without clean invalidation.
More Examples: Same Game, Different Shape
The main thing with perp-driven coins is that they do not all behave the same. Some squeeze shorts, some bait longs, some grind for days before doing anything, and some look completely dead until one OI expansion changes the whole chart. The ticker changes, but the mechanics are usually the same: thin float, aggressive perp activity, unstable positioning, and eventually one side gets forced out.
BSB: Bigger Coin, Same Perp-Dominant Structure
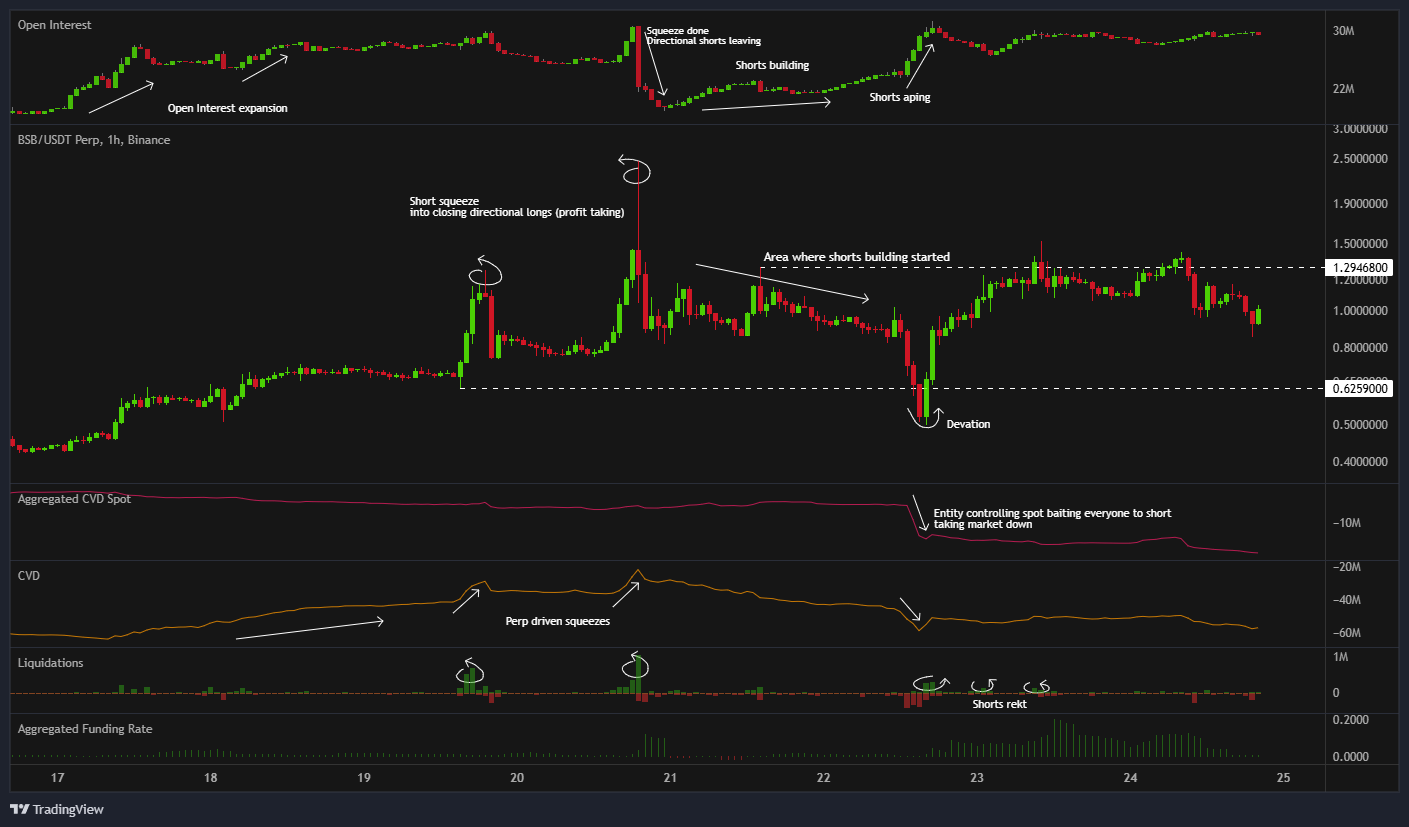
BSB is a good reminder that you cannot only look at market cap. It was not some tiny microcap casino. Market cap was around $217M and FDV almost $977M, but the structure was still heavily perp-driven. Perp volume was around 8.27x spot volume and OI/MC was around 18.1%. Not the same insanity as 50%+ OI/MC names, but still enough to make the chart sensitive to positioning.

Then when you check the bubble map, spot also does not look like clean organic holder distribution. It looks clustered, BSC-based, and controlled by a few large entities. So the lesson is simple: a coin does not need to be tiny to trade like a leverage game.
AGT: When OI Builds, Leaves, Then Comes Back Again
AGT is a good example of why I care about OI structure so much. You can see the same thing repeat: OI expands, price reacts, then leverage starts leaving while price compresses. Most people look at that part and think nothing is happening, but that is usually where the market is resetting.
If price can hold the range while leverage leaves, that is constructive. If price loses the range while leverage leaves, the move is probably done. So I do not look at OI like “high OI = short” or “rising OI = long.” I care where the OI built, where it exits, and what price does during that exit. When compression is done and CVD wakes up again, then it gets interesting.

AGT is a clean OI structure example. OI expands, price moves, leverage leaves, price compresses, then the next expansion sends it again. OI alone is not the edge. The edge is watching what price does while leverage enters and exits.
BLUAI: The Reset Before Another Expansion
BLUAI is another clean example of how these coins reset before moving again. MC was only around $13.4M, but combined OI was already around $7.6M, putting OI/MC near 57%. That is not normal market structure. That is a leverage-heavy coin. Perp volume was also around 7.59x spot volume, so again, spot was not the main story. The real fight was happening in perps.
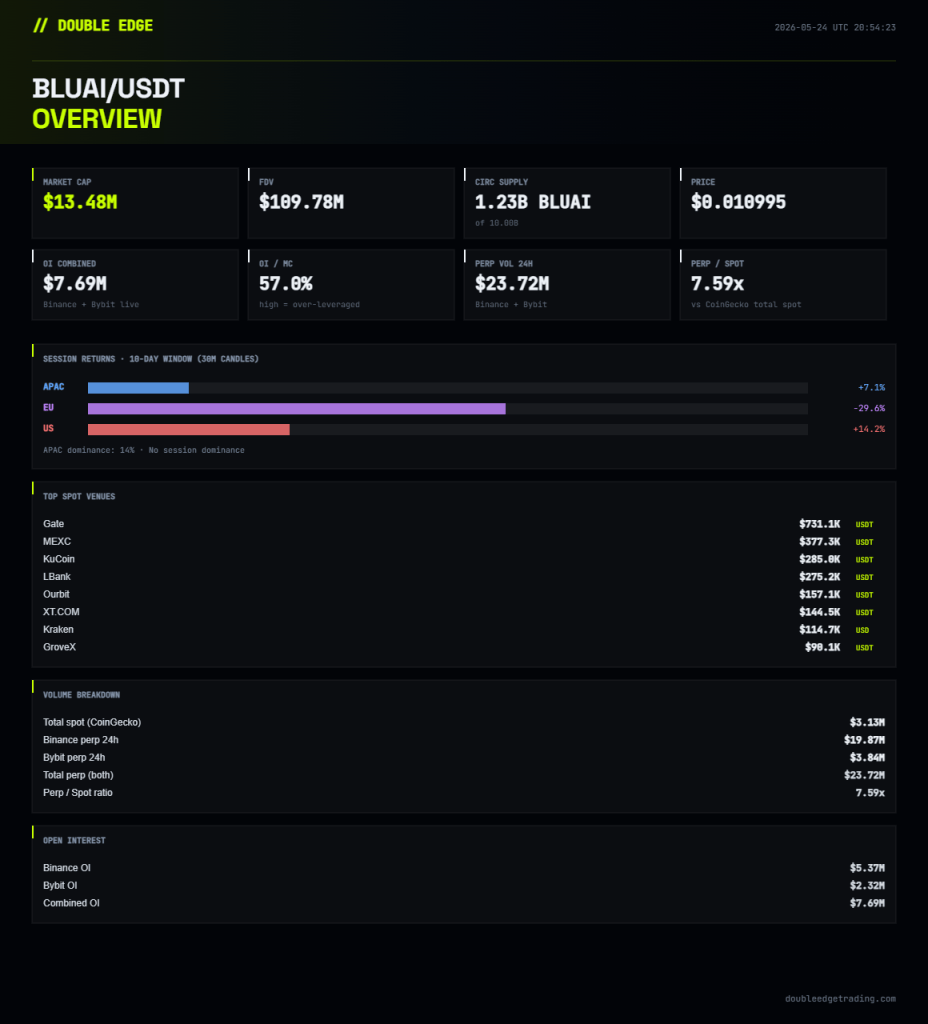
What makes BLUAI interesting is the reset pattern. OI expands, price reacts, then leverage leaves the system while price either compresses, holds a level, or hunts both sides before the next move. This is why chasing the first spike is usually trash. The better trade often comes after the reset, when leverage is cleaned out, structure holds, and the next OI expansion starts building.

BLUAI was basically perp disease in one chart: tiny MC around $13.4M, OI/MC near 57%, and perp volume around 7.59x spot. When the perp book is that big versus the actual market, spot is not the battlefield anymore. Leverage is.
The Lesson?
Perp-driven does not mean bullish or bearish. It just means the coin is sensitive to positioning. If shorts are crowded, funding is negative, price is compressed, and CVD starts coming back, you can get a nasty squeeze. If longs are crowded, funding is positive, price is already vertical, and CVD stops confirming, the fade can be brutal.
The metric alone is never the setup. Negative funding alone is not a long. High OI alone is not a short. Perp/spot alone is not a trade. The edge starts when all of it lines up with structure and price action.
How to Find These Coins Manually
You can find these markets manually, it just takes time. Start with CoinMarketCap to check MC, FDV, circulating supply, spot venues, and spot volume. Then use Coinalyze or Velo for the perp side: OI, funding, liquidations, CVD, volume, and whether leverage is entering or leaving the system.
Coinalyze gives you most of the core metrics for free. Velo is cleaner because the coin page puts CVD, OI, funding, volume, and spaghetti-style relative views together, so you can read the whole fight faster. After that, check BubbleMaps for supply concentration, because low float is one thing, cooked supply is another.
Only then I open TradingView and mark the range, invalidation, reclaim levels, failed highs, sweep zones, and where trapped positioning would actually get forced out. First understand the battlefield, then decide if there is a trade.
How I Filter These Markets Faster
You can find these coins manually. CMC for MC, FDV, supply, spot venues, and volume. Velo or Coinalyze for OI, funding, liquidations, CVD, and perp volume. BubbleMaps to see if supply is clean or cooked. TradingView for the actual setup. This works, but doing it across hundreds of perps every day gets annoying.
That is why we built the Cartel Coin Scanner. It is not a buy button. It just filters the market and shows where the structure is already weird: high perp/spot, elevated OI/MC, funding pressure, CVD behavior, low float, session dominance, and relative strength.
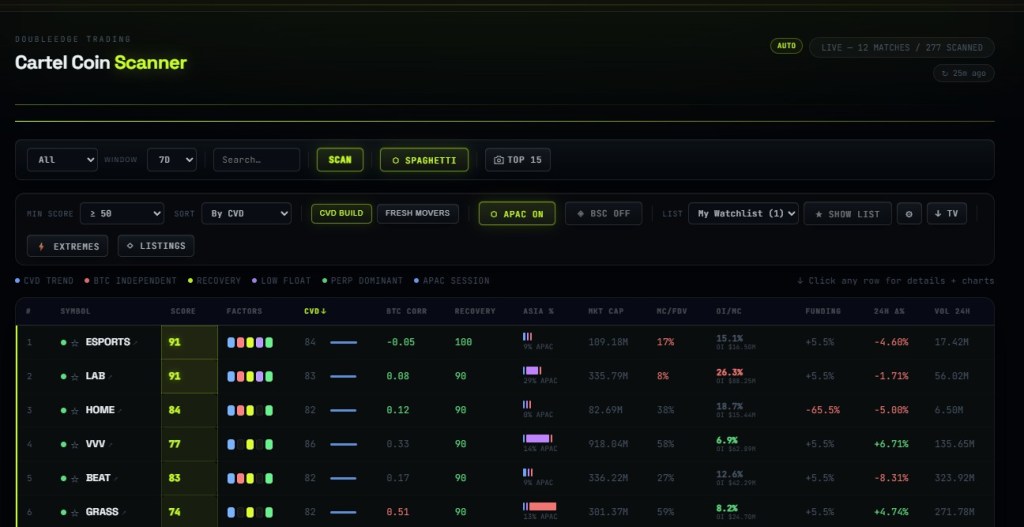
Cartel Search scans Binance altcoin perps and ranks coins with weird market structure: low BTC correlation, compressed price action, CVD behavior, perp/spot imbalance, float structure, OI pressure, funding, and session activity. It is not a buy or sell signal. It just filters the casino and shows which coins are worth opening the chart for.
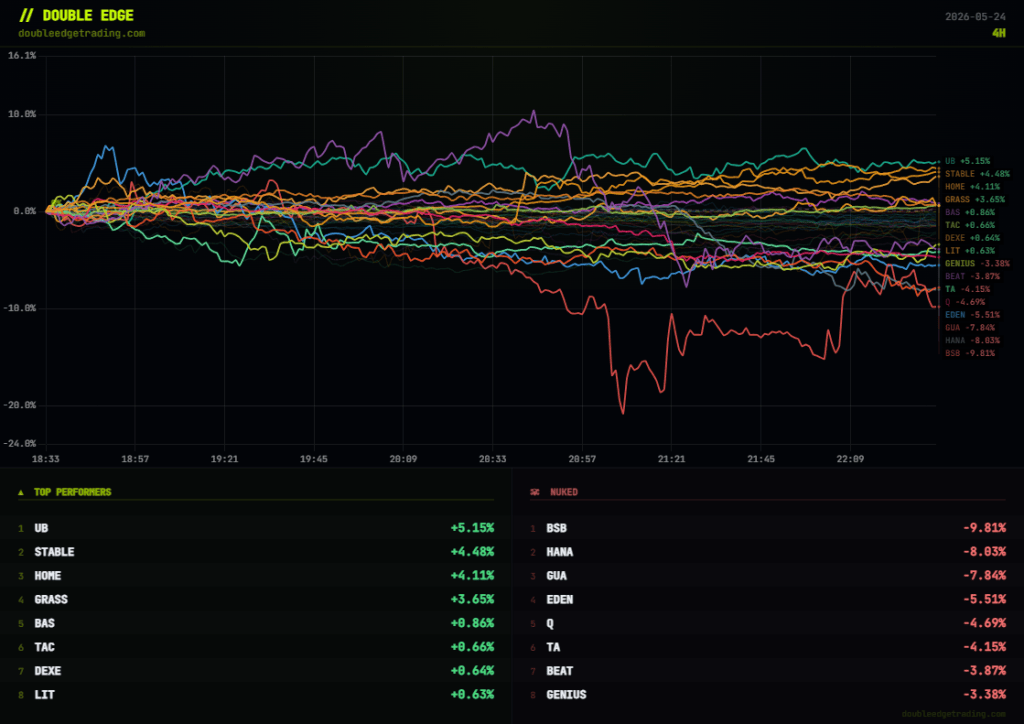
Spaghetti takes selected coins from the scanner and puts them on the same starting line, so you can instantly see what is leading, what is lagging, and what is getting nuked. Instead of opening 20 charts one by one, you get the relative strength picture in one view.

Listing Radar tracks fresh and upcoming Binance/Bybit perp listings, plus “dark spot” setups where a coin already has spot activity on smaller venues but is not broadly listed yet. Basically, it helps you catch early attention before the market makes it obvious.
Want to use the scanner yourself?
Access the Cartel Coin Scanner: Register here
Final Thought
Perp-led coins are not bullish or bearish by default. They are positioning-sensitive. They can squeeze way harder than makes sense, then fade way harder than people want to believe. Small free alpha: on these OI expansion moves, the candle that creates the impulse often becomes the reference point later. When price comes back to test that area, it is usually one of the better spots to have bids instead of chasing the middle of nowhere.
You can trade both directions, but fades should be at extremes, ideally when leverage starts leaving the system. Candles can overshoot like idiots, so the edge is not just “short big green candle.” It is knowing where the fight started, where positioning is trapped, and when the pressure finally starts unwinding. Find the battlefield first, then decide if there is a trade.