Liquidity Walls Are Not Support: How to Read an Order Book Heatmap

You open the heatmap and there it is: a thick yellow wall sitting just above price.
Suddenly everyone has the same trade. Short the wall, put the stop a little above it, collect the easy rejection.
Nice plan. Until price gets close, the order disappears and BTC trades straight through the level as if nothing was ever there.
The wall looked terrifying right up until it had to do its job.
This is the main problem with reading heatmaps from screenshots. A large limit order tells you what somebody is advertising right now. It does not tell you whether that order will still be there in thirty seconds. It definitely does not promise a reversal.
Think of the order book as a live auction. Orders can stay, move, refill, get cancelled or get completely run over. The useful information is not the bright band itself. It is what the band does once price gets close enough to make the owner uncomfortable.
Displayed size is intent. Execution is the part that costs real money.
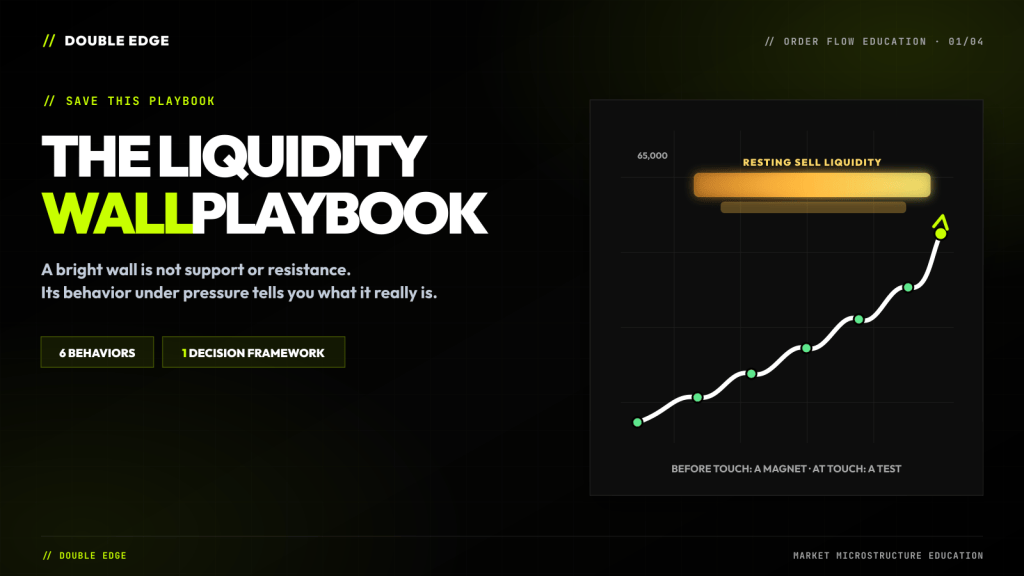
What You Are Actually Looking At
An order book heatmap records resting limit orders through time. Brighter areas usually mean more displayed size.
Above price you normally see asks: traders offering to sell. Below price you see bids: traders offering to buy.
If buyers want to move through a large ask, they need enough aggressive market buying to consume it. The same thing works in reverse at a large bid. Nothing mystical there.
The mistake is turning that basic mechanic into: “big ask equals resistance.” Sometimes it does. Sometimes the seller cancels. Sometimes the seller keeps reloading and absorbs every buyer in sight. Sometimes the order is completely real and still gets destroyed.
Same yellow band. Four very different trades.
Order Book Heatmap and Liquidation Heatmap Are Not the Same Thing
This gets mixed up constantly.
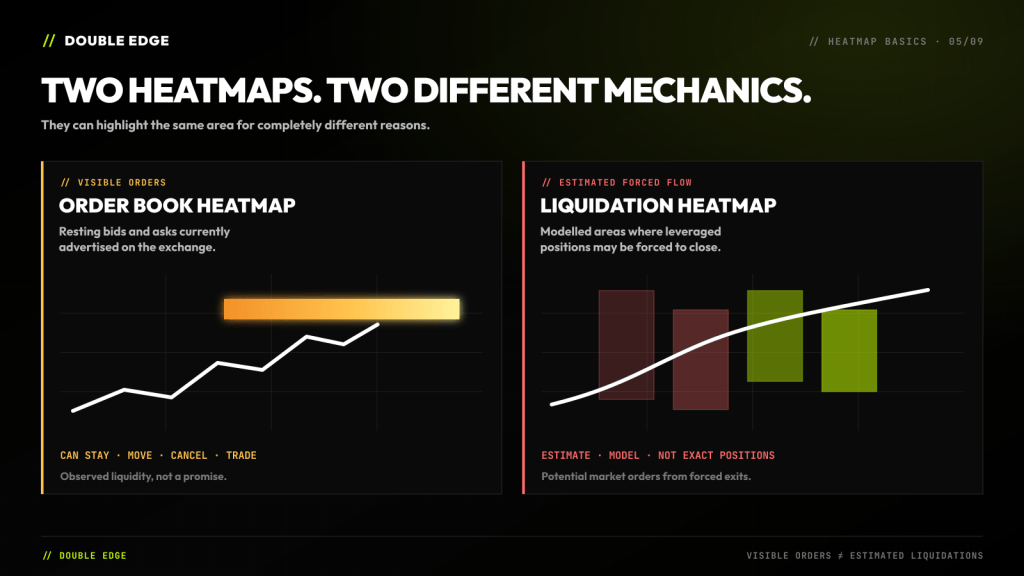
An order book heatmap shows visible limit orders. Those orders exist on the book, but they can be changed or cancelled.
A liquidation heatmap is an estimate of where leveraged traders may be forced out. It is trying to model future market orders from liquidations. You are not looking at a pile of visible stops with exact names and sizes.
Both can point toward an area that attracts price. The reason is different. One is advertised liquidity; the other is a model of potential forced flow.
If you confuse the two, the read gets messy very quickly.
A Spot Wall and a Perp Wall Are Not Equal
One more detail matters in crypto: which market are you actually watching?
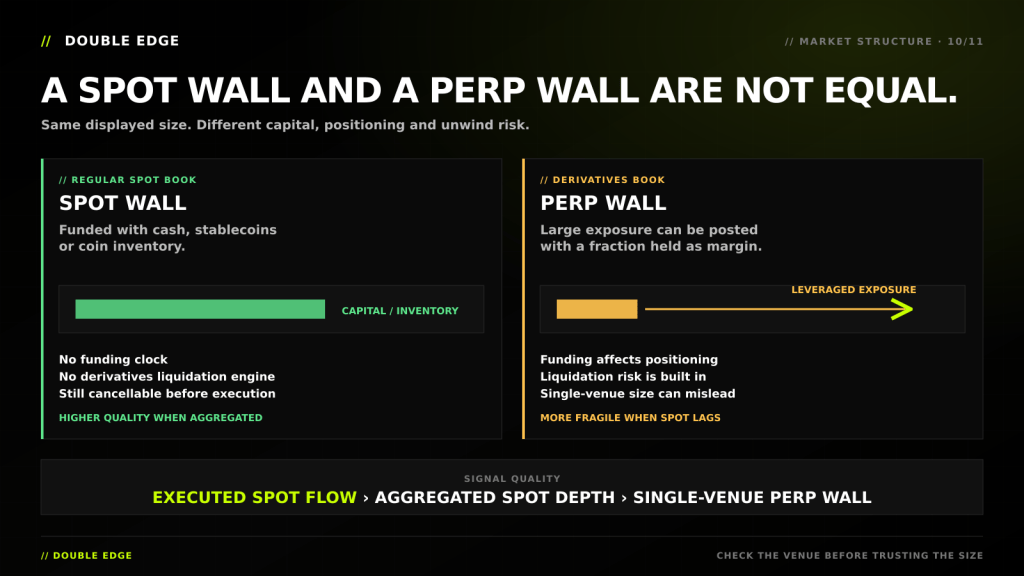
A bid on a regular spot book has to be funded with cash or stablecoins, while an ask requires coin inventory. On a perpetual book, the displayed size is contract notional and may require only initial margin rather than the full notional value. That does not make perp liquidity fake, but it means the book can reflect more leverage and may change faster when positioning unwinds.
That does not make every spot wall genuine. It can still move or disappear like any other limit order. But a wall that persists across several major spot venues generally deserves more attention than one monster order sitting on a single perp book.
And once the order actually trades, executed spot flow is more useful than either screenshot.
A decent hierarchy is:
Executed spot flow → persistent aggregated spot liquidity → single-venue perp liquidity
If price rises with aggressive spot buying and support across the major books, the move is being paid for. If price climbs mostly on expanding perp Open Interest while spot lags, it may still go higher, but the structure carries more leverage and can unwind faster.
The Only Three Moments That Matter
You do not need fifty rules for this. Break the interaction into three parts.
Before price touches the wall, it can act like a magnet. Markets need counterparties, and a visible pool of orders gives price somewhere to do business. That makes the wall a possible destination. It does not make it a reversal level.
When price touches the wall, the real test begins. Does the order stay? Does volume actually trade there? Does the size refill after getting hit? Is price moving for the amount of aggression being spent?
After the touch, stop staring at the wall and watch price. Did it reject and gain distance? Did it trade through and hold above? Did the old ask come back as a bid on the retest?
The first bounce is often noise. The reaction after the reaction is usually more useful.

When the Wall Is Probably Real
The simplest case is also the most useful: price arrives, the wall stays and meaningful volume trades into it.
Imagine BTC pushing into a large ask. Market buyers keep lifting. You can see volume print at the level, but price is barely moving. The seller is not just showing size anymore. They are accepting the trade.
That is real resting liquidity.
Now take it one step further. The visible size gets hit, drops, and then appears again at the same level. More buys arrive. It refills again.
That is absorption. It may be an iceberg order, or it may be several passive sellers defending the same area. From a trading perspective, the label matters less than the behavior: buyers are spending aggression and getting very little price progress in return.
This is where the heatmap earns its screen space. You are no longer guessing from a line on a chart. You are watching one side spend real volume and fail to move the auction.
Still, do not front-run it from ten candles away. A wall proves itself at contact, not while price is safely somewhere else.

When the Wall Is Just Bait
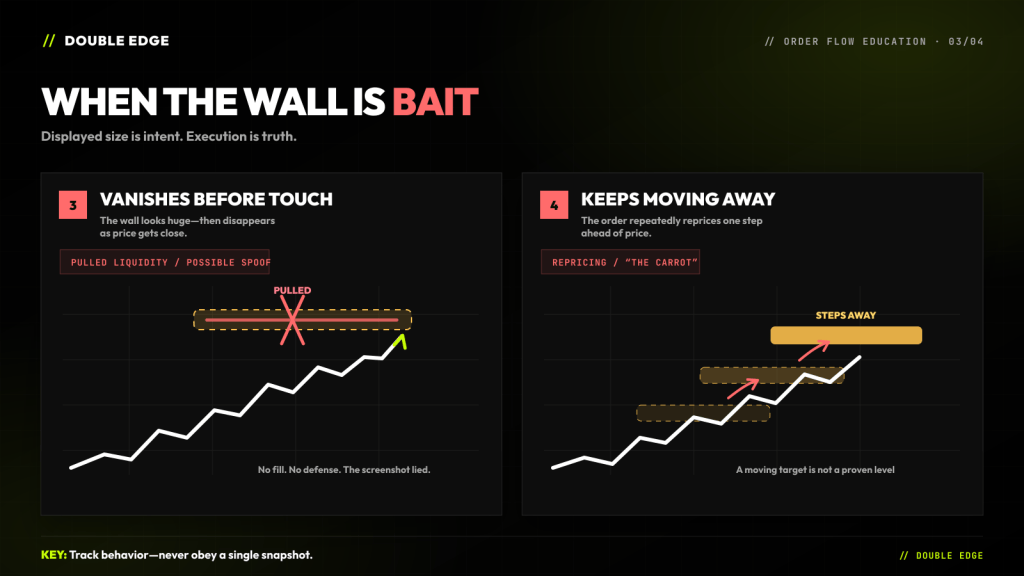
The most obvious warning is a wall that disappears just before price reaches it.
People immediately call every cancellation spoofing. You do not need to get into that argument. Traders cancel legitimate orders all day as price, volatility and inventory change.
For your trade, the conclusion is much simpler: the level was not defended. Nobody traded meaningful size there. The screenshot showed interest, not commitment.
Then there is the moving wall.
Price approaches a large ask at 65,000. The ask moves to 65,050. Price follows and the order moves to 65,100. Again and again.
We call this the carrot. It keeps attracting attention while staying just far enough away to avoid execution. Maybe the owner is repricing. Maybe the order is being used to influence expectations. Either way, it is a moving target — not confirmed resistance.
If you keep shorting in front of it, the market can drag you much farther than expected.
A Real Wall Can Still Lose
This part gets overlooked.
Sometimes the order stays. Sometimes plenty of volume trades. And sometimes the aggressive side is simply stronger.
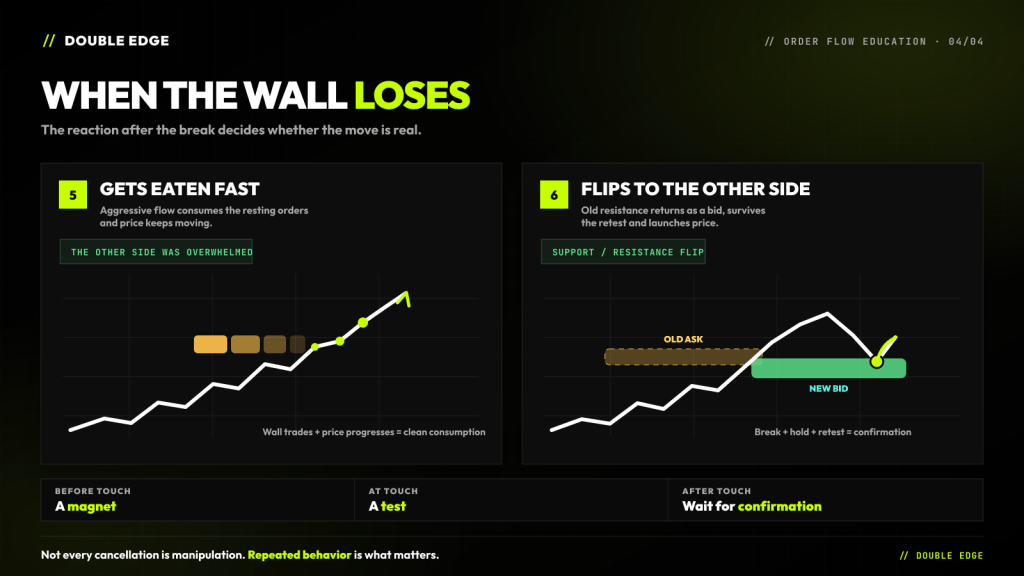
If buyers consume a large ask and price continues higher without stalling, the wall was not fake. The seller lost.
That distinction matters because a failed defense can create more fuel. Traders who shorted against the wall are now trapped, breakout traders are entering, and the old level may be tested from the other side.
The clean version looks like this: the ask gets eaten, price accepts above it, and bids appear around the old level on the retest. Selling hits those bids and price holds.
Now you may have a resistance-to-support flip. Not because an old line magically changed color, but because the order flow actually changed sides.
Order-book imbalance tends to matter more in ranges and early trends. In a strong established trend, aggressive flow can keep chewing through displayed liquidity.
No hold and no successful retest? Then you do not have confirmation yet. You have a breakout candle.
The Liquidation Print Is Not the Signal
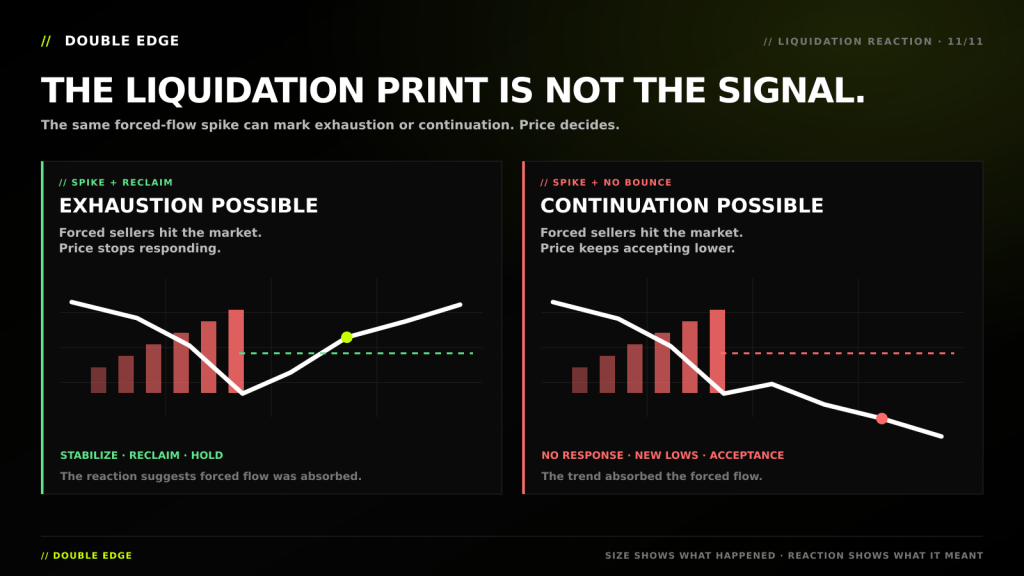
A large liquidation spike looks dramatic, but by itself it does not tell you whether the move is ending or accelerating.
If forced selling hits the market and price quickly stabilizes, reclaims the level or simply refuses to make new lows, the sellers may be exhausted. They had to sell, the market absorbed it, and price stopped responding.
If the same spike produces no bounce and price keeps accepting lower, the trend absorbed the forced flow. That is continuation, not a bottom.
The useful part is what price does next: spike plus reclaim suggests exhaustion; spike with no response suggests continuation.
Use CVD to See Whether Aggression Is Working
CVD is useful here, but only if you ask the right question.
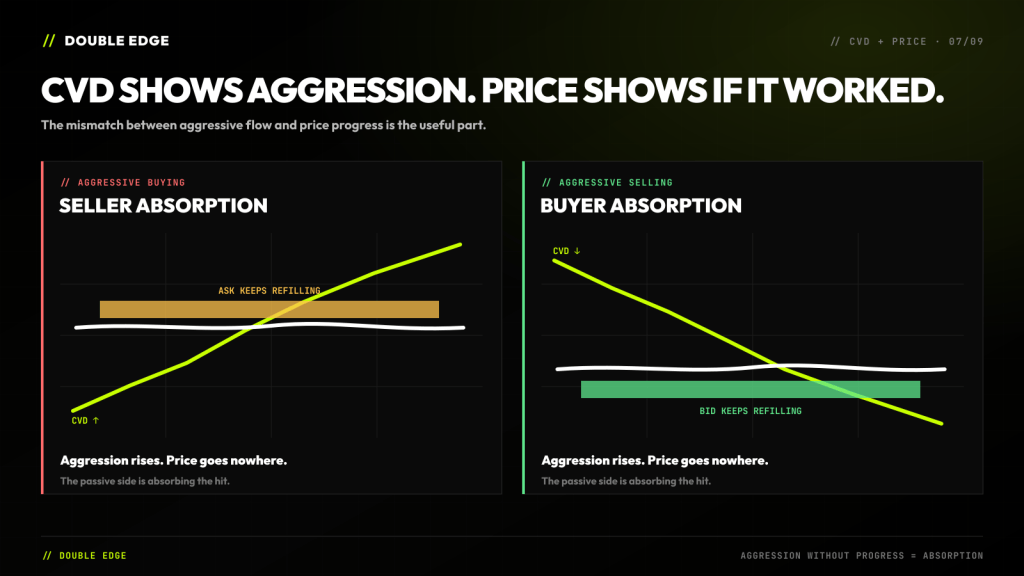
It shows whether aggressive buyers or aggressive sellers are driving the trades. It does not tell you who will win.
Suppose CVD is climbing hard as price hits an ask wall. Buyers are clearly active. But price stops moving and the offer keeps reloading. That mismatch is the information: aggressive buying is being absorbed by a passive seller.
Flip the example at a bid. CVD falls, market sellers keep hitting, but price refuses to break lower and the bid refills. Now a passive buyer may be absorbing the selling.
The useful question is not “Is CVD green or red?” It is: What did price achieve with all that aggression?
Also remember that CVD is venue-specific unless your platform aggregates exchanges. Binance can show one fight while a large part of the market is trading somewhere else.
Open Interest Adds Context, Not a Trade Signal
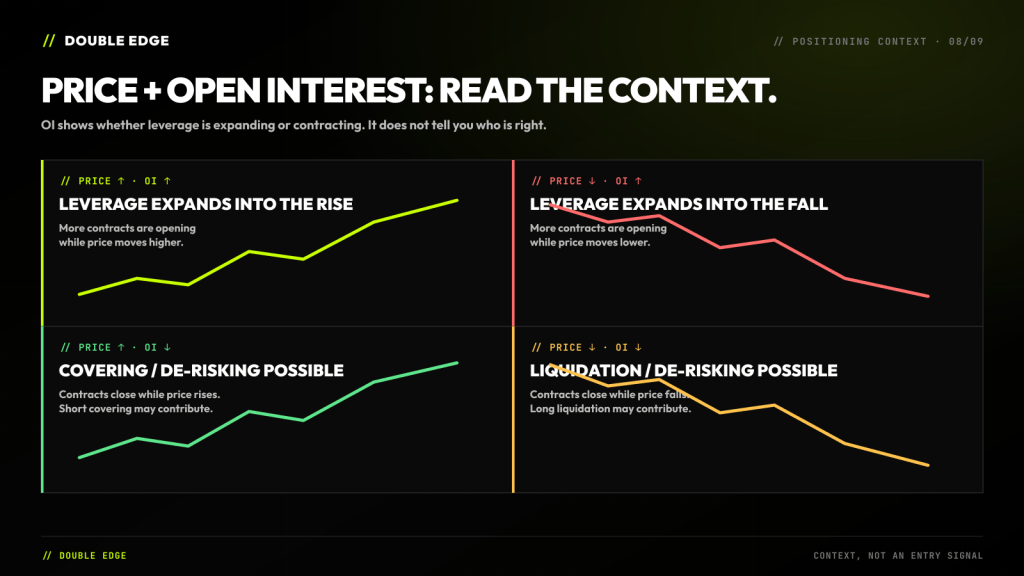
Open Interest tells you whether the number of open derivative contracts is expanding or contracting. It does not directly tell you that “new longs” or “new shorts” are correct. Every contract has both sides.
What OI does tell you is whether leverage is entering the move or being removed from it.
Price rising with OI rising usually means leverage is expanding into the rally. Price rising while OI falls can point to short covering or general de-risking. On the way down, rising OI suggests leverage is expanding into weakness, while falling OI often appears during long liquidations or position reduction.
Those are contexts, not automatic conclusions. Funding, liquidations, spot flow and the price response still matter.
For example, a wall breaking while price and OI both rise is a different environment from a wall breaking during a violent OI flush. The candle may look similar. The positioning behind it is not.
For a deeper breakdown, read our guide to market positioning and Open Interest.
A Practical Way to Trade Around a Wall
Start with the level itself. Is it unusually large compared with nearby liquidity? Has it been there for five seconds or five hours? Is it visible on one exchange or across several?
Then watch the approach. Is price grinding slowly toward it, or accelerating? Is the path between price and the wall thin? Is OI expanding? Are market orders becoming more aggressive?
At contact, forget your prediction for a moment. Watch what actually happens. Does the order stay? Does real volume print? Does it refill? Is price making progress?
Only then read the response. Rejection and distance from the level support the absorption idea. Acceptance through the level weakens it. A break, hold and successful retest can confirm the flip.
The entry comes last. That sounds obvious, but most bad heatmap trades start with an entry and then search for evidence afterward.

A Worked Example
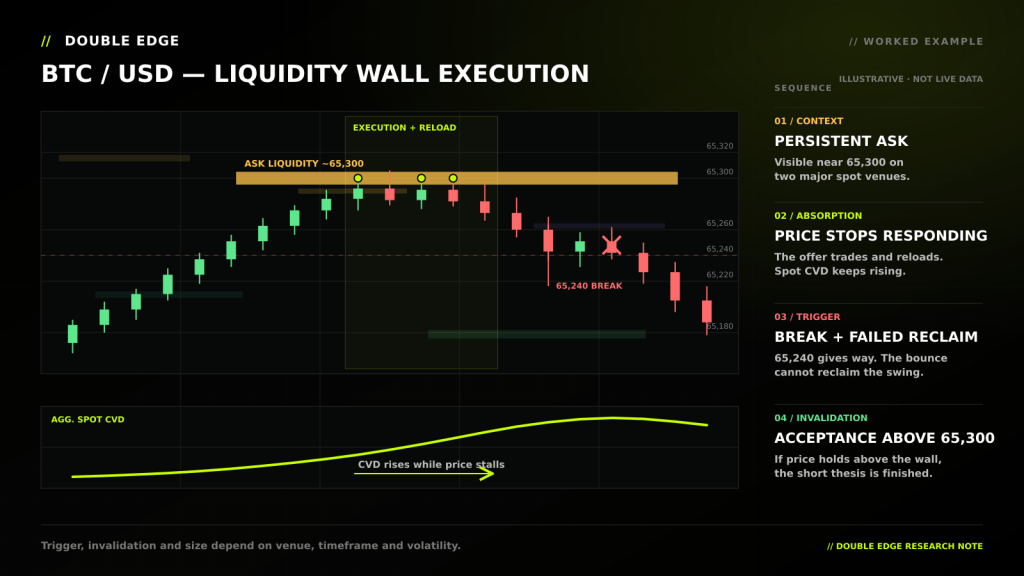
BTC is grinding toward a large ask around 65,300 that has remained visible on two major spot venues for the last twenty minutes. That gives you context. It does not give you a short.
Price reaches the area and market buyers begin lifting the offer. Now you watch the interaction. Meaningful volume trades, the visible size drops and then reloads at roughly the same level. Aggregated spot CVD continues higher, but price stops making progress.
That is evidence of absorption. The passive seller is no longer advertising — they are accepting the trade.
You still need a trigger. Price rolls over, breaks the last minor swing around 65,240 and fails to reclaim it. Now the setup is not “short the wall.” It is “short the failed attempt to trade through the wall.”
The invalidation is acceptance above the area. If price consumes the offer, holds above 65,300 and survives a retest, the seller has lost and the short thesis is wrong. The exact stop belongs beyond that invalidation zone, with position size adjusted so the full stop represents a predefined amount of account risk.
If the old ask returns as a bid and holds, do not keep fighting the original idea. The short setup is gone. The retest may now become a long setup — but it still needs its own confirmation.
A Quick Cheat Sheet
| What you see | What it probably means |
|---|---|
| Wall stays and meaningful volume trades | Real resting liquidity |
| Size refills after repeated hits | Absorption / possible iceberg |
| Wall disappears before contact | Pulled liquidity; defense never proved |
| Wall repeatedly moves away | Repricing or “the carrot” |
| Wall trades completely and price keeps moving | Passive side was overwhelmed |
| Old ask returns as a bid after the break | Possible resistance-to-support flip |
“Probably” is doing important work in that table. None of these is a trade by itself.
What Usually Gets Traders Cooked
The first mistake is trading brightness. A heatmap uses color to help your eyes find size. It is not rating the quality of the level for you.
The second is calling every cancelled order manipulation. You cannot prove intent from one disappearing band, and you do not need to. Just record that the liquidity did not trade.
The third is ignoring the exchange. A huge wall on one venue can look dominant while liquidity and price discovery are happening elsewhere.
And finally, traders confuse a reaction with a reversal. A big wall can bounce price for thirty seconds and still break. Wait to see whether price gains distance, accepts through it or survives the retest.
Final Thought
A wall is an advertisement, not a contract.
Before contact it may attract price. At contact it has to prove itself. After contact, price tells you who actually won.
Watch whether the liquidity stays, trades, reloads, runs away or gets eaten. Then confirm the read with price progress, executed volume, CVD and positioning.
That is slower than shorting every bright yellow band on the screen. It is also a lot less stupid.
For more on Open Interest, funding, CVD, liquidations and positioning, explore the Double Edge education library and our latest market education articles.
This content is for educational purposes only and is not financial advice. Trading involves significant risk.